A new data tool from the Insurance Information Institute (Triple-I) lists vehicle repair cost trends among several factors tied to auto insurance premium pressure.
Triple-I launched the tool, called the Insurance Affordability Index, on Sept. 2. It weighs what households typically pay for personal auto and homeowners coverage against median income figures in their state.
The index rests on three components: an affordability methodology the Insurance Research Council (IRC) has used in its own research, underwriting knowledge Triple-I brings to the partnership, and up-to-date figures reflecting current conditions. Combined, they produce affordability results current through 2025.
IRC, a nonprofit research group, operates independently under The Institute’s umbrella and draws its funding from insurers and trade groups across the property and casualty sector. IRC has said its research is meant to inform public policy discussions rather than to lobby lawmakers or push specific legislative outcomes.
Of the two coverage types, homeowners' insurance takes up the bigger and faster-growing share of household budgets nationally: 2.4% of median household income, a jump of 24% since 2020. Auto insurance is comparatively lighter, at 1.7% of median household income, up 9% over the same span, according to the Triple-I release.
The release notes that these national numbers vary considerably once broken down by state, pointing to how well each state's insurance market is functioning, differing risk levels, and the price of settling claims as reasons for the spread.
Repair costs listed among tracked cost drivers
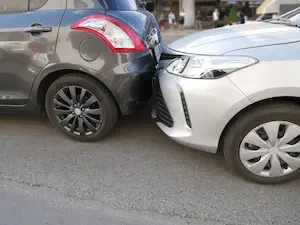
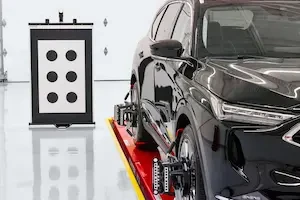
The index includes a category that follows how vehicle repair and home rebuilding expenses have moved over time, and the release states that growth in many of those cost categories has exceeded the economy-wide pace of price increases dating back to 2020. A separate part of the tool ranks each state on cost drivers drawn from IRC research, a list that includes catastrophe exposure, claim frequency and severity, repair costs, expenses, and claims litigation.
"Insurance premiums are shaped by the underlying cost of claims," said Pat Schmid, chief insurance officer at Triple-I and president of the IRC, in the release. Schmid pointed to two forces driving those costs higher, one national and one state-specific: nationwide, the price of fixing a damaged car or rebuilding a home keeps climbing, and in some states, legal system abuse or a heavier concentration of catastrophe losses adds even more pressure on top of that.
Schmid said that when rates fail to keep up with those combined pressures, conditions in that state's insurance market can be affected, a dynamic the release connects to fewer coverage choices and more drivers turning to residual markets.
The index is built around an interactive map of the United States, which users can switch between a personal auto view and a homeowners view. Sean Kevelighan, CEO of Triple-I, said in the release that insurance costs vary by state for identifiable reasons, pointing to differences in local economic conditions, legal and court systems, and exposure to natural disasters as the primary sources of that variation.
Shops already grade insurers using their own metrics
Collision repair shops have their own established way of assessing insurer performance, separate from the affordability lens Triple-I applies. Through CRASH Network's Insurer Report Card, repairers grade insurers on their claims practices. In the 2026 results, more than 1,100 shops graded up to 40 insurers each, weighing whether an insurer’s claims handling makes for a smoother repair and a better experience for the customer.
The two data sets measure different things but touch the same companies. Triple-I's index tracks what households pay into the system. The Insurer Report Card tracks what shops experience once a claim comes out the other end, based on the same insurers' size and market share that factor into the affordability index's state-level rankings.