
Collision repair shops are entering a period defined by rising complexity on every job that walks through the door. That is the central finding of CCC Intelligent Solutions' annual Crash Course 2026: Complexity Compounds report.
The report, authored by CCC Directors of Industry Analytics Kyle Krumlauf and Erik Bahnsen, covers affordability-driven changes in consumer insurance behavior, shifts in the composition of the vehicle fleet, total loss trends, bodily injury escalation, and the macroeconomic pressures layered on top of all of it.
For collision shops, the findings converge on a single operational reality: fewer repairable claims are entering the system, but the ones that do are more technical, more expensive, and more variable than at any point in the past decade.
Repair Volume Is Down; Complexity Per Job Is Up
Repairable claim volume declined 9.7% in 2025 across all coverages, according to CCC national industry data cited in the report. Despite that volume decline, the average total cost of repair (TCOR) reached $4,818 for the year, a 1.7% increase over 2024. Although it’s an increase, it’s important to note that it’s the lowest rate of increase since 2017.
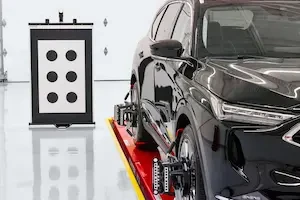
The more significant cost story may be in what is driving those repairs. Calibrations, which include procedures for camera and sensor-based advanced driver assistance systems (ADAS), appeared on 28.3% of all repairable appraisals in 2025, up from 21.8%. That’s a 30% increase in the number of estimates that include at least one calibration.
The report notes a trend toward shifting diagnostic costs out of supplements and onto the initial estimate, which is a direction that shops capturing those requirements earlier in the process are more positioned to benefit from.
An Aging Fleet and Rising Labor Rates
The composition of vehicles coming into shops has shifted. According to S&P Global Mobility data cited in the report, the average age of light vehicles in the U.S. reached 12.8 years in 2025, with a strong likelihood of hitting 13 years in 2026. Passenger cars dropped below 100 million registered vehicles for the first time since the 1970s.
CCC data show that vehicles between seven and 12 years old now represent nearly 41% of total loss valuations, up from 33.4% in 2020. The share of repairable collision claims for vehicles six years old or newer fell to 58.3% in 2025, down from over 67% in 2020, which is a nine-percentage-point shift in five years.
According to Experian data cited in the report, vehicles in operation reached approximately 296 million as of Q3 2025, but the fleet includes roughly 12 million fewer vehicles six years old or newer than it did in 2020.
This fleet composition shift has direct consequences for shops. Average TCOR for vehicles six years old or newer was $5,721 in 2025. That’s about 55.4% higher on average than repairs for vehicles seven years or older.
The mean labor rate across all labor types increased 2.9% in 2025, the lowest rate of increase since 2021. Average labor hours per repair fell 0.8 hours year over year. Labor as a share of TCOR declined marginally year over year, as increasing labor rates and declining labor hours produced nearly offsetting effects, according to the report.
According to CCC data, shop productivity for both drivable and nondrivable vehicles continued to improve year over year through 2025, and cycle times have improved steadily since peaking in Q4 2022.
Total Loss Frequency Reaches New Highs
Total loss frequency rose to 23.1% of all claims in 2025, and 23.9% for non-comprehensive losses, which are both new high-water marks in CCC's data. The share of driveable vehicles flagged as total losses has climbed steadily since 2021, reaching 10.4% of driveable claims in 2025.
The report highlights a customer retention risk tied to total losses. According to CCC's 2024 Moments of Truth customer experience study, the insured switched to another carrier in 40.4% of collision claims that resulted in a total loss. That’s approximately 33% higher than with repairable claims.
Consumer Affordability Pressures Are Filtering Into the Shop
The report documents a significant shift in how consumers are engaging with insurance, with direct implications for claim filing behavior.
According to CCC data, the share of third-party claims submitted as uninsured or underinsured motorist (UM/UIM) features has nearly doubled over the past three to four years, reaching 16.3% in Q4 2025.
In addition, a 2025 Guardian Service survey found that 8% of respondents had downgraded from full coverage to liability-only. CCC's own national data shows the share of repairable collision claims with $1,000-or-higher deductibles grew by more than 3.5 percentage points in the past year alone.
The practical effect for shops: smaller first-party claims are increasingly not being filed at all. Higher deductibles, coverage downgrades, and out-of-pocket repair choices are reducing the filing of smaller claims, removing lower-severity work from the repair stream.
The report also flags a shift in consumer attitudes toward what it calls 'so-called soft fraud,' tied to affordability pressure. A cited study found that 9% of millennial policyholders reported asking repairers to inflate repair estimates to help cover deductibles. For shops, this underscores the importance of consistent documentation and written authorization practices.