
The overall length of rental (LOR) for collision-related rentals in Q2 2025 was 15.1 days, a 0.9-day decline from Q2 2024, matching the decline seen in Q1 2025, according to new data released by Enterprise.
Considering the post-COVID effects of vehicle production and supply chain issues and their effect on LOR in 2022 and 2023, Enterprise instead compared current data to Q2 2020, when overall LOR was 13.2 days — meaning Q2 2025 was 2.9 days higher than the last pre-pandemic quarter.
While LOR continues to decrease from post-pandemic highs, ongoing market and economic conditions could impact future results, Enterprise advised.
“A continued decline in LOR is not surprising, if only because body shops are able to get jobs brought in more quickly,” said John Yoswick, editor of the weekly CRASH Network newsletter, who offered insights based on data from the quarterly “Who Pays for What?” surveys he conducts with Collision Advice.
“The average backlog of work in shops nationwide — how far out they are scheduling new repair jobs — was just 1.7 weeks in April 2025, according to the ‘Who Pays for What?’ survey of 550 shops conducted that month,” Yoswick said. “It was the first time since Q2 2021 that the average backlog was below two weeks, after peaking at nearly six weeks in 2023.
“More than 20% of shops in April 2025 had no backlog at all — a figure that had never been higher, outside of the pandemic year of 2020, since the surveys began tracking backlogs more than eight years ago,” he added.
Ryan Mandell, director of claims performance for Mitchell International, said, so far in 2025, there has been a substantial decrease in OEM parts use — 58.5%, down from 61.1% — combined with an increased parts repair percentage — 16.4%, up from 15.1%.
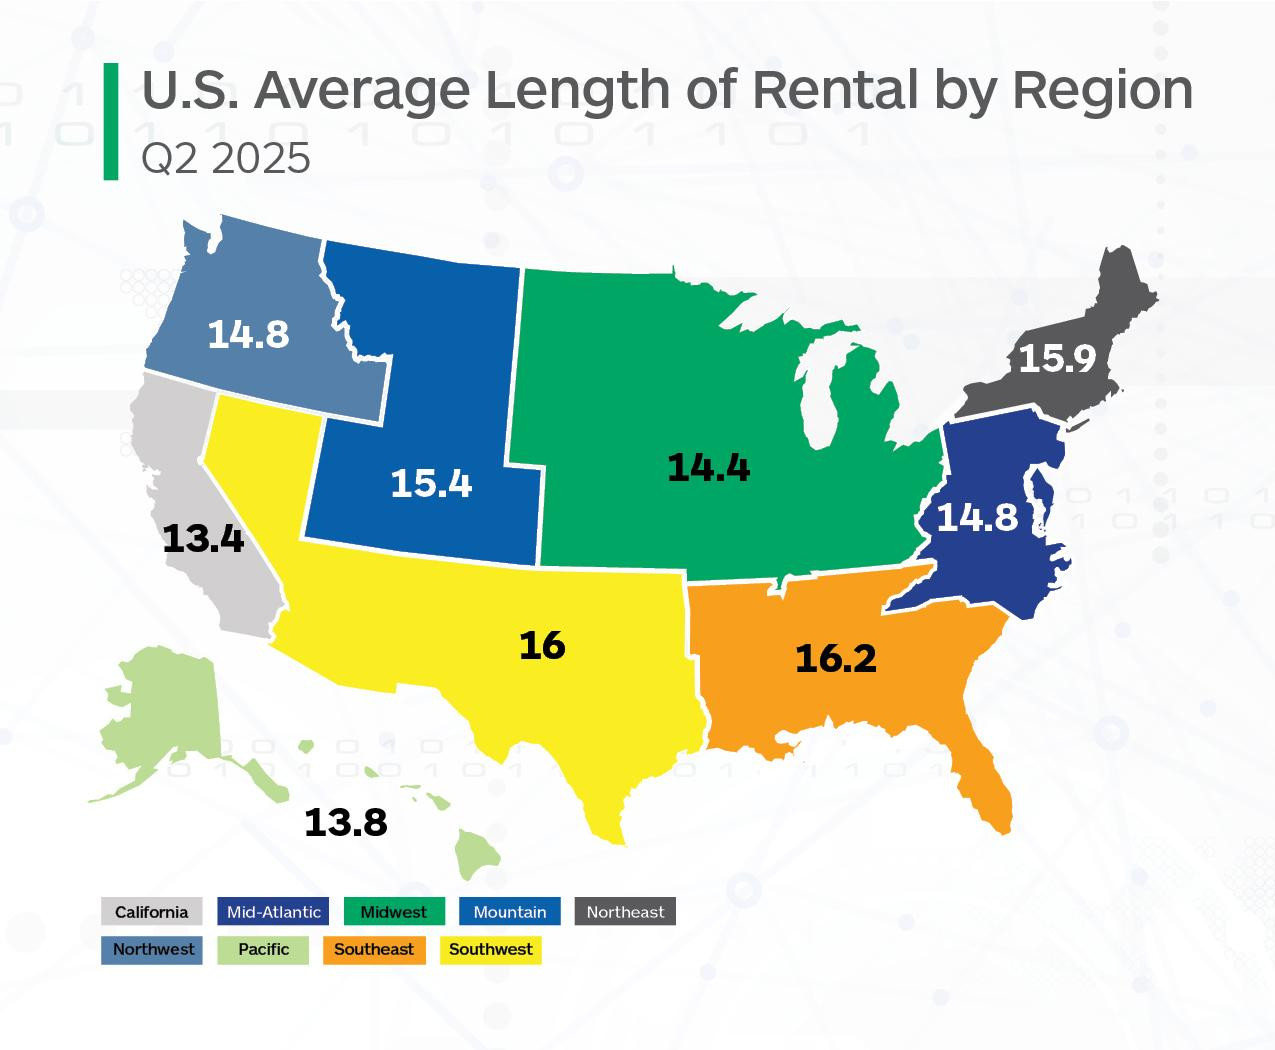 Image via Enterprise.
Mandell said this suggests a “strong industry pivot toward repair over replacement — likely in response to parts cost pressures and availability challenges.
“In addition, consumers continue to face higher out of-pocket expenses, with average deductibles rising to $863 — up $38,” he added.
Greg Horn, PartsTrader’s chief industry relations officer, said his company measures median delivery days by part type to monitor any potential delays that can affect LOR.
Q2 2025 showed a reduction of nearly one average delivery day, similar to the reduction of 0.9 days in Enterprise’s drivable LOR, Horn said.
Alaska recorded the highest overall LOR at 21.0 days, a 0.3-day increase from Q2 2024. Rhode Island was next-highest at 18.5 days, also a 0.3-day increase.
North Dakota had the lowest overall LOR at 10.2 days, while District of Columbia (D.C.) was next-lowest at 11.4 days; both states saw a 0.9-day decline.
Nebraska had the highest increase, with a result of 13.6 days, representing a 0.7-day increase. Kentucky matched Alaska and Rhode Island, as these three states had 0.3-day increases. All other states had declines, with 23 states plus D.C. recording decreases greater than one full day.
Drivable
In Q2 2025, drivable LOR was 13.9 days, a 0.7- day decline from Q2 2024.
Alaska had the highest drivable LOR at 19.6 days, a 1.1-day increase from Q2 2024, followed by Rhode Island at 17.3 days, a 0.7-day increase. North Dakota had the lowest at 8.9 days, followed by D.C. (10.0), Hawaii (10.6) and Iowa (10.9).
Alaska also had the highest increase of 1.1 days, followed by Nebraska (+0.8 days), Rhode Island (+0.7 days), and six other states — Kentucky, New Hampshire, Vermont, Missouri, Oklahoma and Ohio — all seeing increases of up to half a day.
Colorado, Delaware and Idaho had the largest decreases, with results down 2.5 days, 2.3 days and 2.2 days, respectively.
Non-Drivable
Non-drivable LOR was 20.7 days in Q2 2025, a 1.7-day decrease from Q2 2024. Alaska had the highest non-drivable LOR at 29.7 days, which was still a 2.2-day drop from Q2 2024. West Virginia was next-highest at 27.9 days, followed by Vermont (25.4 days), New Mexico (24.1) and South Carolina (24.0).
D.C. had the lowest non-drivable LOR at 16.9 days, with North Dakota (17.1) and Iowa (17.5) next-lowest.
Nebraska was the only state to record an increase in non-drivable LOR, going from 19.3 days in Q2 2024 to 19.6 days in Q2 2025. Kentucky’s result at 23.4 days was flat compared to Q2 2024.
Montana, Colorado and Idaho had non-drivable decreases greater than five days.
It will bear watching Q3 2025 results in several states, including Missouri, Texas, Colorado and Kentucky, given severe weather events in late May and June.
Total Loss
LOR for rentals associated with total loss claims was 13.4 days, a 1.4-day decline from Q2 2024.
Alaska had the highest total loss LOR at 18.3 days, a 3.8-day increase from Q2 2024. West Virginia (17.4) and Vermont (17.1) followed.
South Dakota had the lowest total loss LOR at 10.1 days, followed by North Dakota (10.4) and Iowa (11.3).
Alaska’s increase of 3.8 days is an outlier, as Wyoming (+1.0 days) was the only other state with an increase. South Carolina (15.4 days) was flat compared to Q2 2024.
All other states plus D.C. saw decreases, with D.C. and 38 states seeing declines greater than one full day.