Kyle Krumlauf, director and industry analyst for CCC Intelligent Solutions, and Dan Risley, CCC vice president of quality repair and market development, addressed a webinar audience recently on the ways in which the evolving U.S. car parc is affecting auto claims and repairs.
Their presentation revolved around several key trends revealed in CCC’s Q1 2025 Crash Course Report.
Vehicle Age and Sales
Krumlauf began with vehicle age, which he pointed out is trending older. In Q3 2020, more than 110 million vehicles in operation were 6 years old and newer. By Q3 2024, that number had fallen by 8% to 101.5 million. In the meantime, the car parc has increased by 10 million, or 3.7%, he said. There are now 292.3 vehicles in operation, two-thirds of which are 7 years old or older.
The pandemic negatively affected the light vehicle average for sales on a 12-month basis. Prior to the onset of COVID, from January 2018 to February 2020, that number hovered around 17.1 million. Supply chain disruption, pandemic protocols and demand challenges meant it fell to 14.9 million between March 2020 and February 2021. The average fluctuated from there but didn’t fully recover as inflation after the pandemic brought higher vehicle prices and finance rates.
New vehicle prices have risen. Krumlauf’s quoted numbers showing the average transaction price for a new vehicle averaged $47,462 in March, according to Cox Automotive. The average APR for new vehicles, according to Edmunds, was 7.2%.
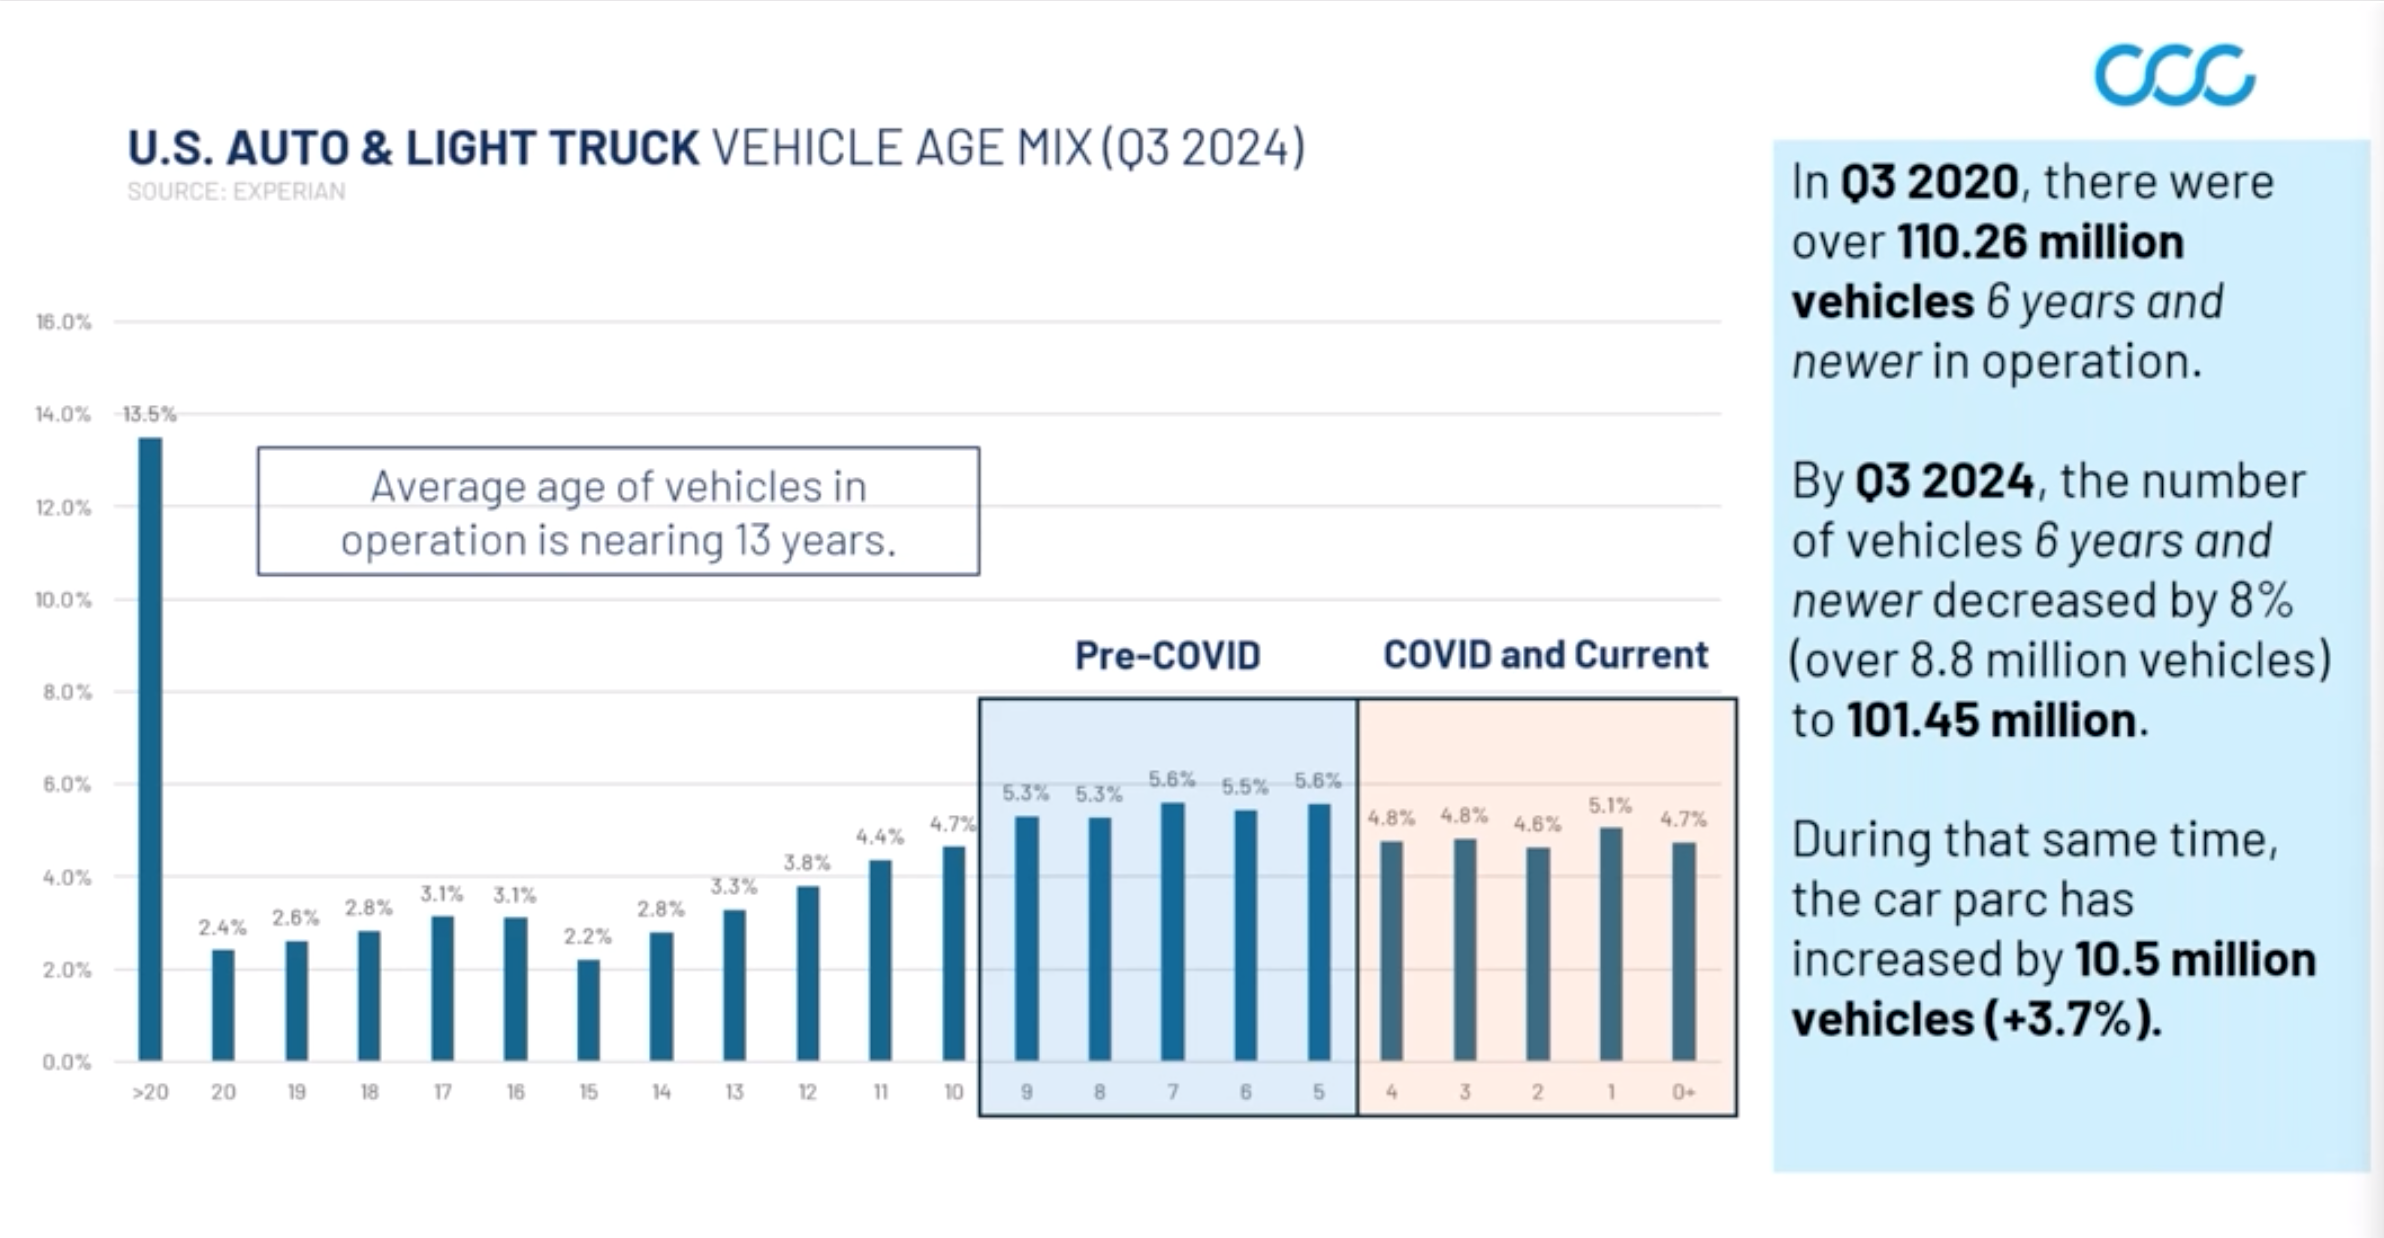 This chart shows the decrease in vehicles ages 6 years and newer from 2020 to 2024. The overall vehicle population is skewing older. The pandemic drove sales averages down, and they still have not recovered to pre-pandemic levels. Images via CCC.
“It’s become a lot more expensive to purchase a new vehicle,” he noted.
When it comes to used vehicles, list price is currently about $25,000. In March, the average used vehicle APR was 11.5%, and the average amount owed on upside down auto loans was $6,838. Also on the rise are delinquencies and repossessions; this number continues to increase.
“There are some underlying factors that I think are very concerning when it comes to auto financing,” Krumlauf said.
Claims Trends
According to CCC national industry data, the share of repairable appraisals as of Q1 2020 for vehicles 7 years or older was 38.4%. That number rose to 46.8% in Q1 2025. The rise, Risley said, represents consumers keeping vehicles longer. The number of vehicles 6 years old and newer has decreased since 2020, except for vehicles current year model or newer, which increased slightly, representing a gradual increase in new vehicle sales.
As far as the types of vehicles coming into the car parc over the past five years, there’s been an increase in SUVs and crossovers, which now represent 50% of new and/or current model year vehicles. This is mostly because shares of newer sedans or cars has decreased, Krumlauf said. The trend, he said, goes along with the size of vehicles increasing. High-performance engines and luxury interior specs are driving up cost. Risley posited that total cost of repair could well correlate with the rise in SUVs.
Looking at claims by fuel type, less than 5% of vehicles in operation in the U.S. use alternative types. Electric vehicles make up 1.4%; hybrids 3.3%. Internal combustion engines (ICE) still add up to 95.2%.
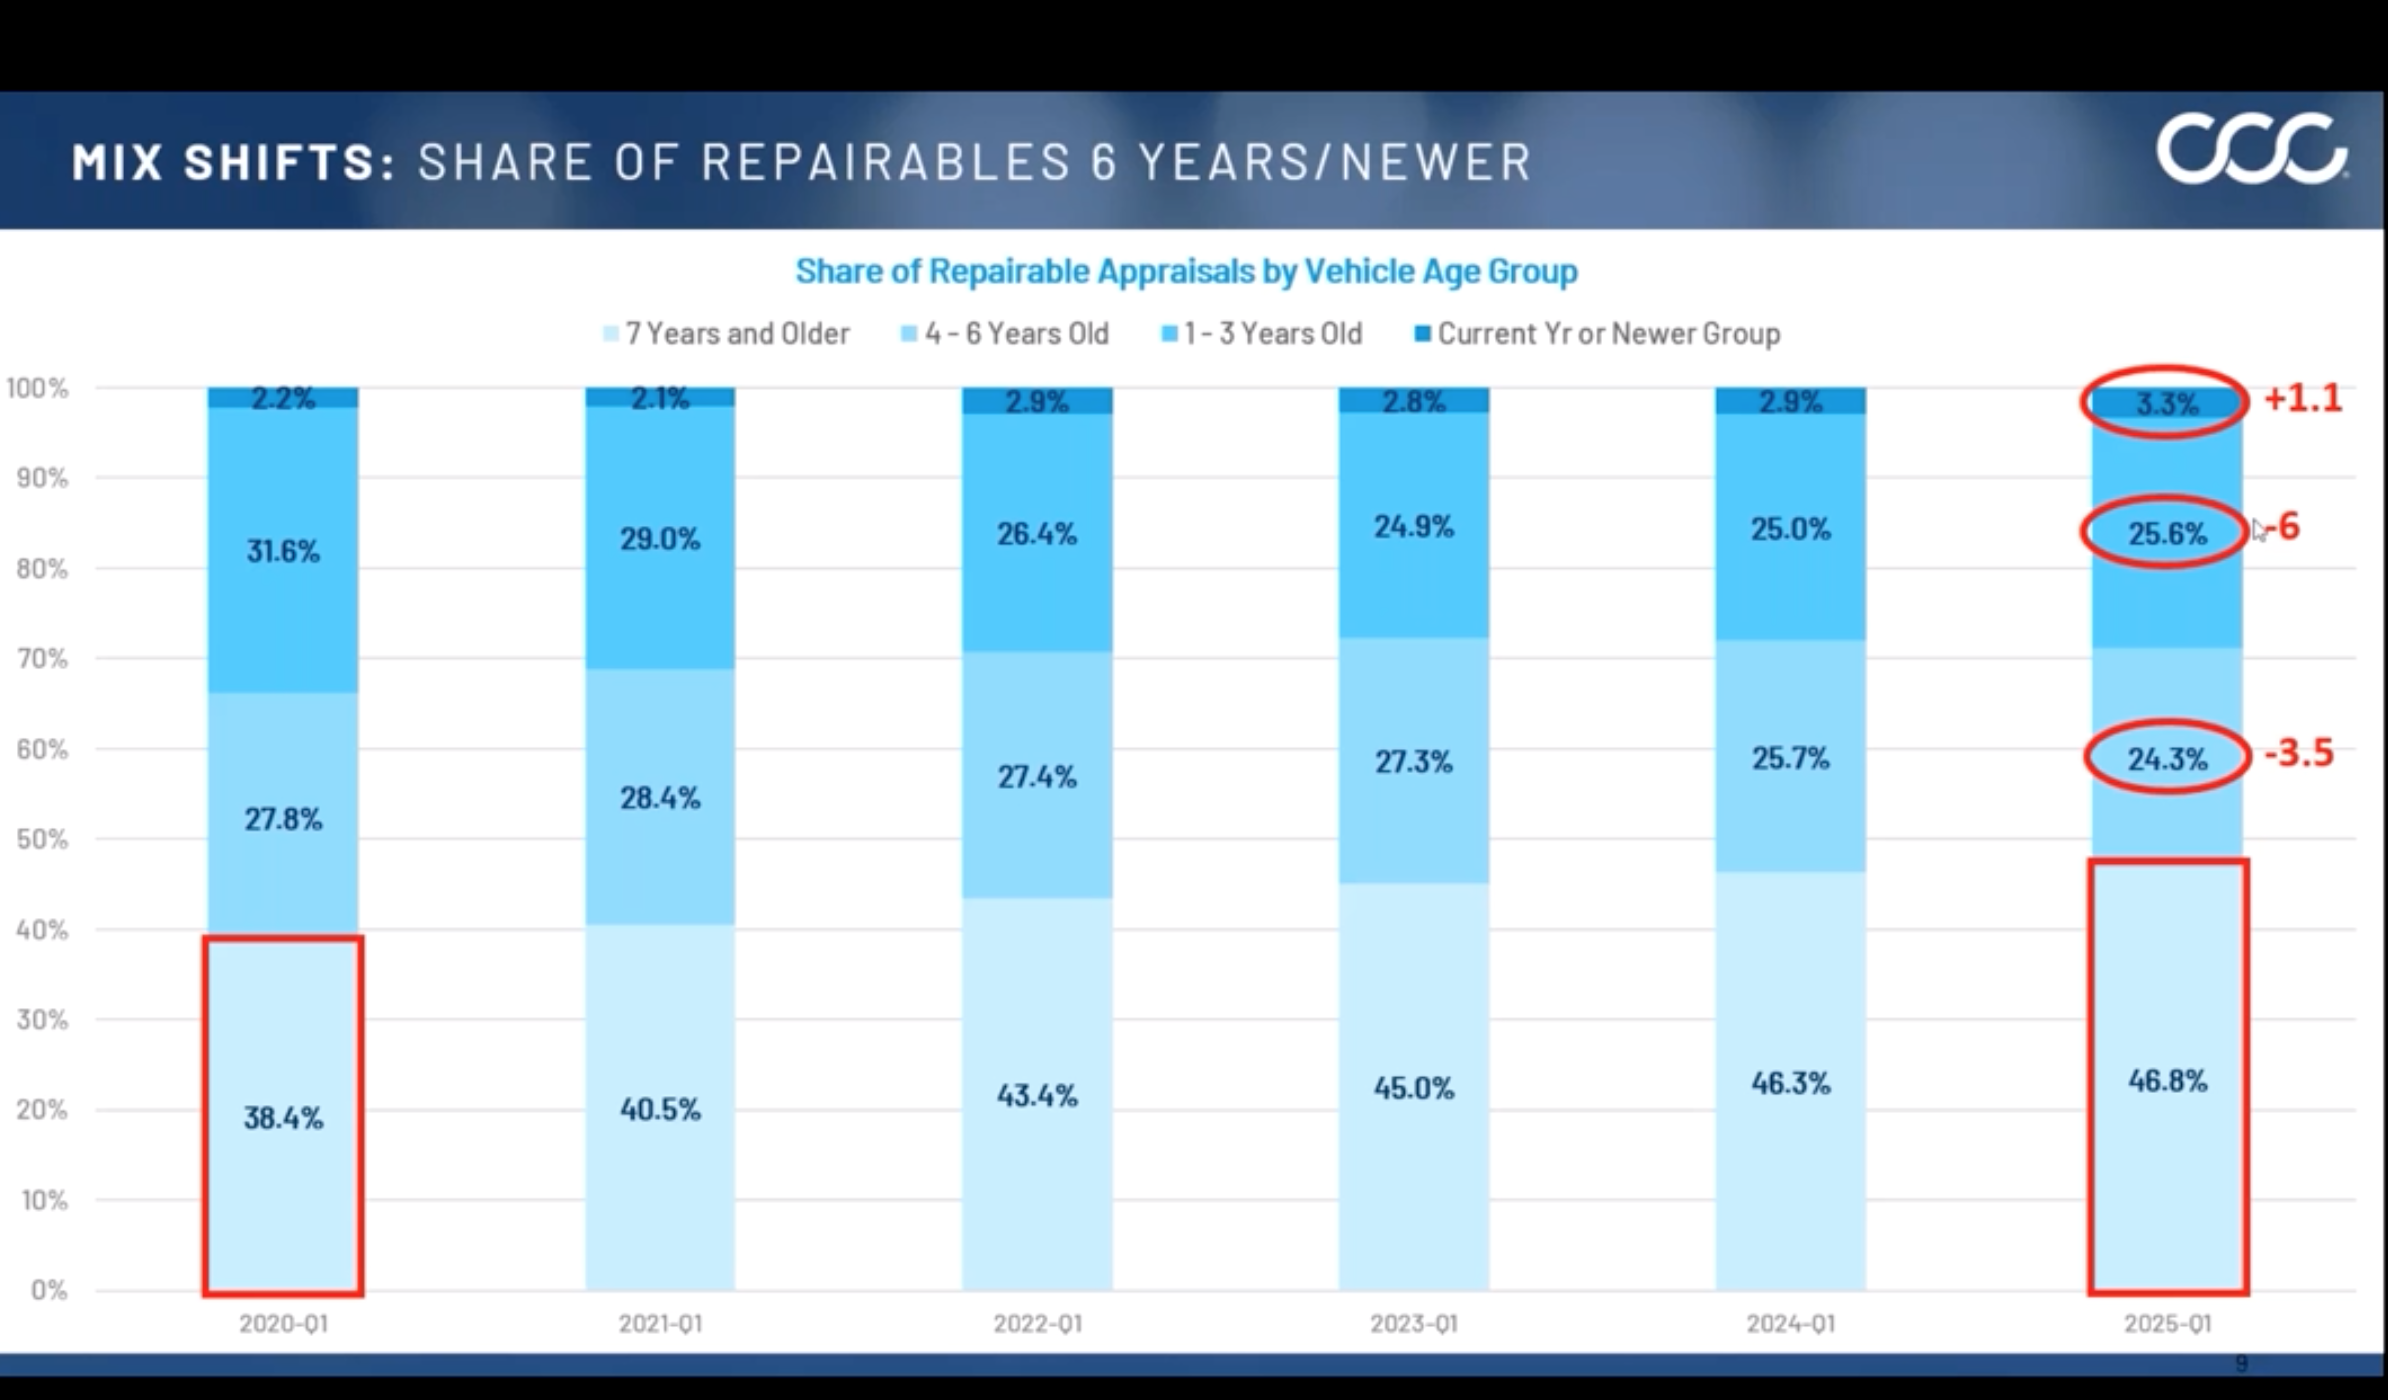 The share of repairable appraisals in vehicles 7 years or older has increased by nearly 8% since 2020.
In Q1 2020, 0.5% of vehicles in operation were EVs and 3.2% were hybrid. ICE vehicles made up 96.2% of the car parc.
Risley pointed out newer model hybrids are becoming increasingly part of the overall claim mix.
“As the mix of hybrids becomes more mainstream, and we start to see a greater percentage of those falling into the claims pool, I think that’s also going to be another driver of the severity,” he said. “So, I think everybody’s hypersensitive to severity numbers, and there are a lot of factors that help influence that. And I certainly think this will be one that we need to watch closely because it will be an influencer as time moves on and they become a greater percentage of the overall mix of repairable claims.”
Total cost of repair trends by fuel type for vehicles 3 years old or newer revealed interesting takeaways. In noncomprehensive claims between 2020 and 2024, hybrid costs increased by 50%, while ICE vehicles saw a more than 40% climb. Electric vehicles rose just over 15%, and vehicles overall increased 42.1%.
“The parity between hybrid and EV is getting very close,” Krumlauf noted, adding the difference was more than $1,800 in 2020 and has come down to less than $600.
Contributing to higher severity in electric versus ICE engines, Risley posited, are part availability and alternative part choices. There’s less variation for newer EVs, Krumlauf said, and labor can also drive up costs in EVs with more miscellaneous costs.
Diagnostics and Calibrations
In vehicle diagnostic trends, 70.6% of Q4 repairable appraisals included a scan, up from 66.9% in Q4 2023. Numbers were higher for direct repair program (DRP) estimates: 86.5% in Q4 2024, up from 81.8% in Q4 2023. Risley predicted this DRP number will continue to rise. For Q4 2024, 30.4% of repairable DRP appraisals included a calibration. This number rose from 22.1% in Q4 2023.
“The share of appraisals that include calibrations — that’s up over eight percentage points year over year,” Krumlauf noted. “That’s a large increase.”
Risley, however, expressed surprise the overall numbers were so low.
“What’s a surprise to me is that it’s still at 30%,” he said. “I think if you speak to some of the car manufacturers, they would challenge that number and say ‘That number probably should be a little bit higher than 30%.’”
Krumlauf posited the number is “probably weighted down a lot by older vehicles.”
Indeed, Crash Course Report data reveals numbers closer to 50% for vehicles one year and newer.
Krumlauf pointed out more than 57% of Q4 2024 calibrations from DRP appraisals appeared on a supplement, while just over 43% appeared on the original estimate. Risley called that number “alarmingly high” and said it could include subsequent supplements.
“If you’re identifying calibrations later in the process, there’s probably a very good likelihood it’s going to have a negative impact on cycle time, which has a negative impact on length of rental,” he said. “When you stretch out the cycle time, it has a corresponding negative impact on the overall customer satisfaction index score. Now, tools in the marketplace to help identify upfront what calibrations might be necessary by adjusting year, make, model, VIN, point of impact, etc.”
The cost of scans and calibrations has risen significantly. In Q1 2017, the total cost of scans in 100 claims was $428, and calibrations $151. By Q4 2024, the total cost of scans in 100 claims was $10,672, and calibrations were $10,630.
“That is an exponential increase but also a huge change in the cost structure of repairs,” Krumlauf said.
Risley predicted scans numbers will continue to grow, but not necessarily in the trend of the past few years. Calibrations, however, he said, will “continue to grow and grow” as the numbers of calibrations per claim rises. Those numbers will be impacted by ADAS features present.
More than half of registered vehicles are expected to have six or more ADAS features by 2028. The number of registered cars with backup cameras will likely be at 76%, 51% will have front automatic emergency braking, 50% will have lane departure or blind spot monitoring, 14% will have curve-adapting headlights and 21% will have adaptive cruise control with lane centering.
“The need for diagnostics — how that’s going to continue to proliferate — this really is just setting the stage for that just to continue to increase,” Krumlauf said.
Shops outsourcing calibrations, Risley said, will probably begin looking at resources to keep those things in-house and mitigate ancillary costs. He pointed out that calibrations can be static or dynamic with both taking place sometimes on the same vehicle. Although more calibrations are dynamic now, he sees nothing in the pipeline in terms of standardization.
“I don’t see standardization necessarily on the horizon for us, but it’s certainly something for us to keep a watch for,” he said. “And as far as self-calibrating vehicles, that is something that I think is on the road map for the car manufacturers. It’s not something that we’re seeing today, but it’s not out of the question for us to see that probably in the near future.”
The industry, he predicted, may see more calibrations on EVs with more ADAS features, but that’s not necessarily the case now. He said he didn’t think of engine type is a driver of calibrations. Fuel type, Krumlauf said, isn’t an indicator of tech content, but tech content proliferates no matter what.
Cost of Insurance, Consumer Behavior
The cost of insurance has risen over the past five years, and that fact is apparent when looking at the share of repairable appraisals under $2,000. In Q1 2020, that number was at 43.2%, but it had eroded to 25.7% in Q1 2025.
Krumlauf said consumer behavior in regard to claim filing often includes dropping coverage on older vehicles to try to mitigate premium increases. People are increasing their deductibles, so there are more claims filed in higher deductible brackets, he said, or they're refraining from filing claims to keep their rates from going up. Some simply don’t have coverage.
Consumers often don’t understand the actual cost of repair, Risley said. Fender benders can be upwards of $2,000, and ADAS features drive up that cost.
Krumlauf said part of the propensity to avoid repairs could be due to inflation. “Look around you,” he said. “You see a lot of vehicles that are damaged on the road today. That is highly representative of people not getting things fixed.”
There’s significant erosion in the lower-cost repair tier. Customer self-pay represented 24.2% of orders in 2024. That number rose to 25.1% in Q1 2025, up from 20.1% in Q1 2023. The amount consumers were willing to pay rose from $1,423 in Q1 2023 to $1,954 in Q1 2025.
“The amount that they are willing to pay out of pocket for repairs is right around that $2,000 mark, and I think that’s really interesting,” Krumlauf said.
The average total cost of repairs is now more than $4,720, up about 3.5% year over year, but it’s no longer increasing at rates seen a few years ago, Krumlauf said.
Total loss frequency is increasing while used vehicle prices go down. All loss categories rose from 20.6% in 2020 to 22.3% in 2025; the fact the age mix is skewing older will drive total losses, he said. Fewer claims being filed likely will drive up total loss rate, and total loss values are still elevated for newer vehicles.
Tariffs: Questions and Unknowns
Finally, Krumlauf addressed the hot button topic of the day: tariffs. Several questions characterize this issue, he said.
First: How do industry members apply the tariff orders? There’s lots of interpretation in application of the orders, he said, including stacking and exemptions.
Next, which segments of the portfolio will tariffs affect? Identifying part and vehicle origins is difficult; there’s no data that says which parts come from which country. Vehicle origins can get tricky, depending on where parts came from. They might have crossed borders multiple times, Krumlauf pointed out, which makes it hard to determine impact for claims and total losses.
Finally, what is the potential impact for businesses? Changes to tariff policies and aforementioned challenges are shifting and evolving daily, Krumlauf said, making it hard to track them or model out potential impacts.
The industry average price per part in February 2021 (with a 10% tariff on China) was $125.94. In February 2025, it was $145.68.
“We are definitely seeing some increases year over year when it comes to average price per part,” Krumlauf said. “Some of that could be preemptive. Some of that could be opportunistic.”


Elizabeth Green