Overall length of rental (LOR) for collision-related rentals in Q1 2025 was 16.7 days, a 0.9-day decline year-over-year, according to new data released by Enterprise.
In Q1 2024, the collision repair industry saw a decline of 1.1 days from Q1 2023, when overall LOR was 18.7 days.
However, overall LOR in Q1 2025 is still 3.5 days higher than it was five years ago, before the COVID pandemic affected new-vehicle production and the supply chain -- in Q1 2020, it was 13.2 days, and in Q1 2019, even lower at 12.8 days.
“Some trends suggest that there might not be significant drops to LOR moving forward this year if claims count doesn’t fall further,” said John Yoswick, editor of the weekly CRASH Network newsletter.
“Two years of decline in the average shop backlog of work came to an end in the first quarter of this year,” Yoswick said. “The ‘Who Pays for What? survey conducted in January by Collision Advice and CRASH Network found that among more than 750 responding shops, the average backlog of work was 2.6 weeks, up half a week compared to prior quarter. An increase in backlog between the fourth and first quarter is not unusual, but this increase was slightly larger than typical, perhaps an indication that the industry is finding its new ‘normal’ range after eight consecutive quarters of backlog declines.”
Parts are the largest cost portion of the repair estimate, and delays in parts delivery impact cycle time. Greg Horn, PartsTrader’s chief industry relations officer, offered insight.
“The quarter-over-quarter reductions seen in LOR align with PartsTrader’s median delivery days (plus two standard deviations); the parts median delivery days have improved in Q1 2025 compared to the same quarter in 2024,” Horn said. “A lower claim frequency seen by many of PartsTrader’s clients has also resulted in quicker shop throughput, which reduces cycle time.”
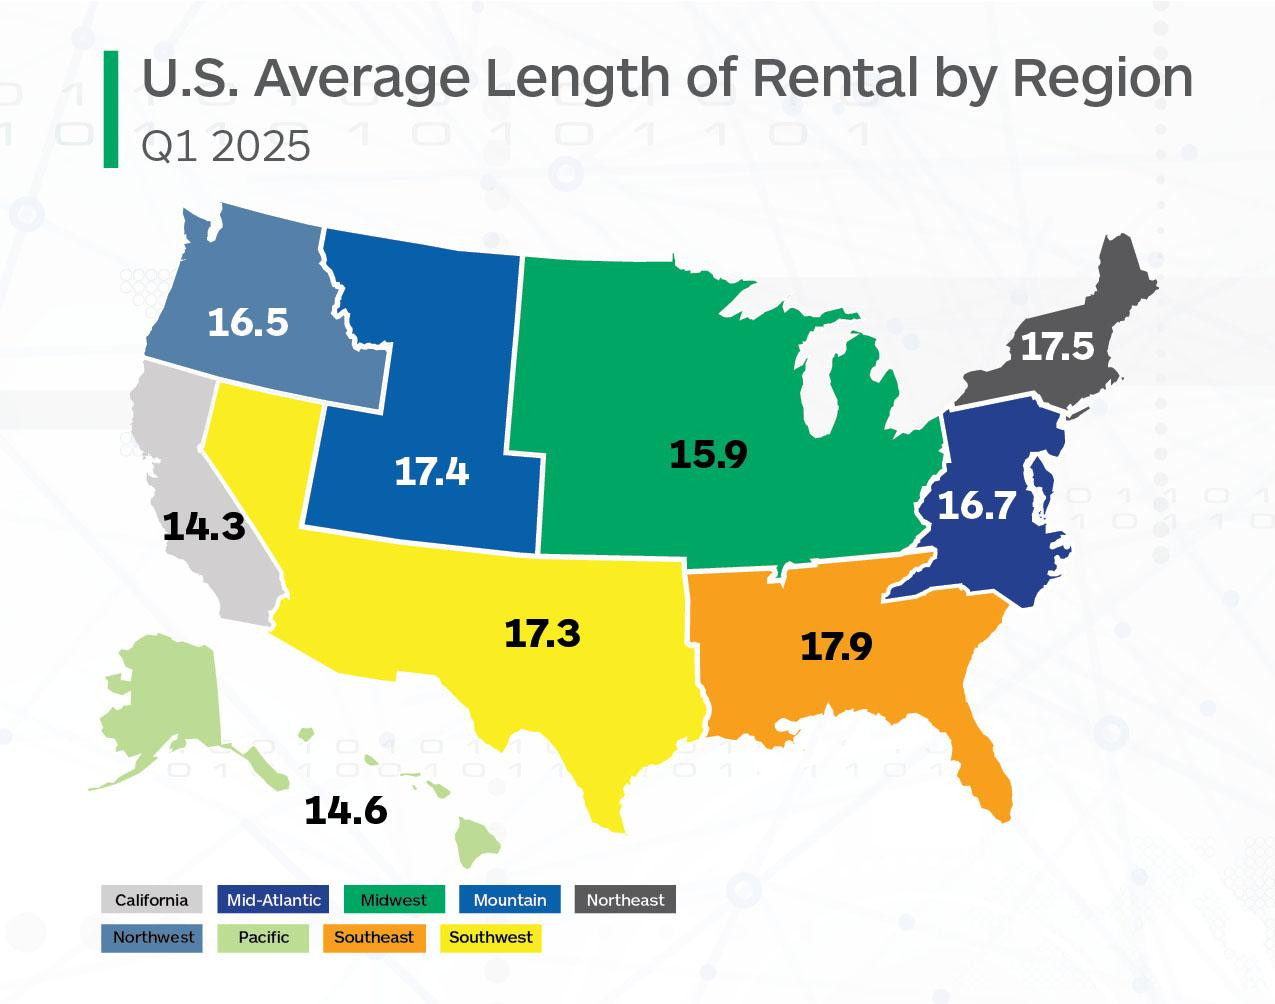 Graphic via Enterprise.
“Frequency of diagnostic operations in the U.S. rose to 87.4% in Q1 2025, up from 84.3% in Q1 2024,” said Ryan Mandell, director of claims performance for Mitchell International. “Calibration frequency also increased to 25.3%, up from 23.4% in Q1 2024. The average number of calibrations per estimate (when calibrations are present) also increased to 1.46 per estimate in Q1 2025, compared to 1.38 in Q1 2024. We expect the frequency number of 25.25% to increase above 30% once the data is fully mature, as calibration operations are often added as supplemental items and are not reflected on original estimates. The calibration frequency number for Q4 2024 ended at 29.4%.”
Alaska recorded the highest LOR at 20.8 days, a 0.1-day increase from Q1 2024. West Virginia had the next-highest LOR at 20.7 days, followed by New Mexico at 19.8 days.
North Dakota had the lowest LOR at 12.0 days, a 1.1-day decline from Q1 2024. Hawaii followed with 12.6 days, ahead of District of Columbia at 13.0 days.
Nebraska and Vermont had the highest LOR increases at 0.6 days; Iowa, New Hampshire and Arkansas all recorded higher LOR this quarter versus Q1 2024.
Montana had the largest LOR decrease, down 2.6 days from Q1 2024, followed by Idaho (-2.5 days), with Nevada and Colorado both down 2.2 days.
Drivable
For rentals associated with drivable claims, LOR was 15.2 days in Q1 2025, down 0.6 days from Q1 2024’s results of 15.8 days.
Alaska had the highest drivable LOR at 18.5 days, a 0.9-day increase from Q1 2024. Rhode Island followed at 18.4 days, but this represented a 0.9-day decline from Q1 2024’s results. Georgia (18.1 days) and Oklahoma (18.0 days) rounded out the top states with the highest drivable LOR.
North Dakota had the lowest drivable LOR at 10.1 days, followed by D.C. (11.1 days) and Hawaii (11.2 days).
Nebraska and Vermont each saw drivable LOR increases of one full day, with nine additional states seeing an increase.
Tennessee had the largest drivable decrease at 1.9 days, closely followed by Indiana and Nevada with 1.8-day decreases.
Non-Drivable
LOR for non-drivable vehicles was 22.8 days, a 2.2-day decline from Q1 2024.
Alaska had the highest non-drivable LOR at 29.6 days, followed by West Virginia (29.4 days) and New Mexico (28.6 days).
Iowa had the lowest non-drivable LOR at 19.2 days, followed by California and D.C., both at 19.8 days.
All states, plus D.C. and Puerto Rico, had declines in non-drivable LOR. Alaska had the smallest decrease, down 0.6 days, followed by New York (-0.7 days), D.C. and New Hampshire (each down 0.8 days). Montana had the largest decline, with non-drivable LOR down 6.2 days from Q1 2024, followed by North Dakota (-5.7), Colorado (-5.5), Idaho (-5.2) and Delaware (-5.0).
Twenty-nine states, plus Puerto Rico, saw non-drivable LOR decline by at least two full days.
Total Loss
LOR associated with total loss claims in Q1 2025 was 14.9 days, a 1.5-day decline from Q1 2024.
West Virginia had the highest total loss LOR at 19.4 days, followed by Alaska (18.4 days) and Kentucky (18.3 days).
North Dakota had the lowest LOR at 12.5 days, just edging out Minnesota at 12.6 days. Idaho (13.0 days) and South Dakota (13.1 days) were next-lowest.
Idaho had the largest total loss decrease, down 4.0 days from Q1 2024, while Minnesota (-3.5 days) and Connecticut (-3.2 days) were next-lowest. In fact, all states and D.C. had total loss decreases.
“U.S. total loss frequency rose to 22.4% in Q1 2025, up from 21.1% in Q1 2024,” Mandell said. “The biggest increase came with older vehicles (10+ years old), which saw an increase of 0.95 percentage points, followed by vehicles aged 0-3 years old, which saw an increase of 0.87 percentage points.
“An increase in total loss frequency means there are less borderline vehicles that are ending up as repairable and thus preventing a segment of larger, lengthier repairs from entering shop workflows, thereby reducing bottlenecks and improving cycle times,” Mandell added. “We expect that severity, once the data is fully mature, will not increase as much as in previous quarters as a result of some of these higher dollar repairs being written off.”
Looking Ahead
While LOR continues to decrease from the post-pandemic, outlying highs, challenging market and economic conditions could have impacts to future results.
“Perhaps the biggest unknown is the larger economy,” said Yoswick. “Should it falter, vehicle miles traveled -- which has rebounded to above pre-pandemic levels -- could decline, further lowering claims count, and overall financial uncertainty may lead more drivers with moderate vehicle damage to forego having it repaired."